I do a lot of 3D printing and electronics work in my workroom:

Lately I’ve been doing a lot of soldering iron work for prototyping:

Normally, my soldering is all reflow soldering of surface-mount components, so the board goes into a toaster oven and the whole thing is soldered in 60 seconds. By comparison, soldering that protoboard took me probably 8 hours of work with a soldering iron.
I do use an activated charcoal filter to suck the solder smoke fumes, but honestly it doesn’t seem to work very well. After a couple hours of soldering, the air in my room is thick to breathe. I have my suspicions that it’s not very good for me. Add to that I’m curious what kind of plastic particles come off the 3D printer while it’s running (I suspect not many as I only print in PLA/PETG, but still).
After much humming & hawing, I went out and impulse purchased this device:
https://www.airthings.com/en-ca/view-plus
It cost $425 CDN. I sat in the car for THIRTY minutes trying to justify the purchase and I couldn’t. I walked back in and returned it. The device:
- was crazy expensive
- fed sensor data to some random company I didn’t know
- simplified down the measurements into simple “1-digit” measurements like “happy emoji” and “red LED”
- had no way to neatly export the sensor data into something I could examine and manipulate myself
I decided instead to build my own solution. I went to SparkFun and picked up:
- an Arduino Uno
- an ESP8266 wifi shield
- an SPS30 particulate sensor
- a BME688 multi-sensor
- a CCS811 air quality sensor
I spent a weekend assembling it and another weekend writing the Arduino sketch (firmware) to run on it:

The Arduino acts as a simple wifi-connected server that presents data points in text/plain format:

On my Synology NAS, I created 2 Docker container images:
- Prometheus (a scraper + datastore)
- Grafana (data visualization)
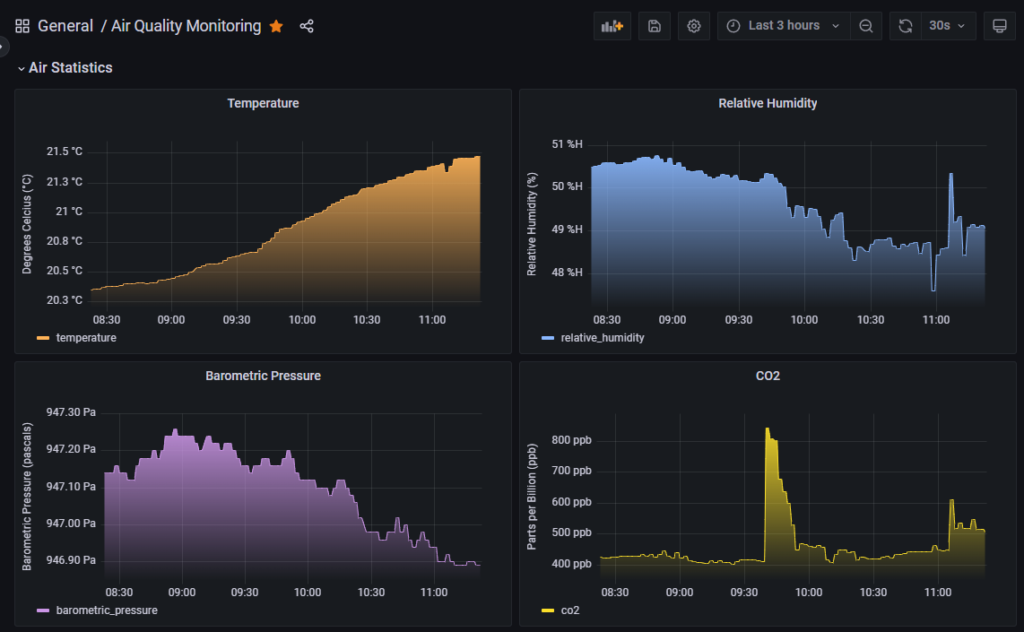
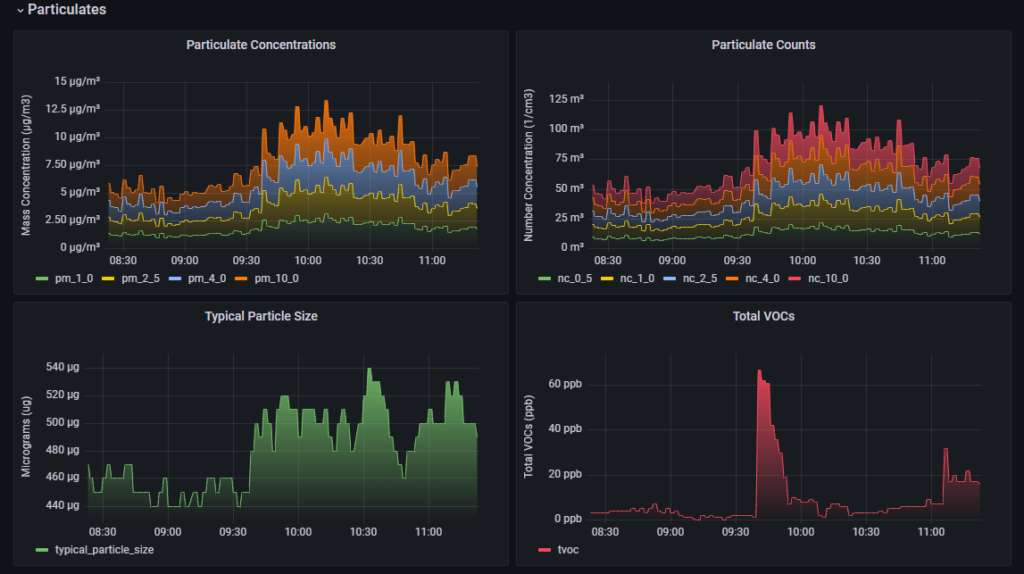
I configured Prometheus to scrape the Arduino output every 60 seconds. I then built Grafana dashboards to display the output:


I’m very satisfied with the results! The total price ended up being about $190CDN and I have full control over the sourcing, storage and display of every piece of sensor data.
I would say the setup is fairly accurate, particularly for identifying trends. I took it outside and the results near-exactly matched the air quality readings of a local Environment Canada weather station. I’m still taking the individual data points with a grain of salt as the whole thing hasn’t been professionally calibrated.
I’ve yet to do any soldering with the system running, so I’m excited to see those charts. So far printing PLA hasn’t even moved the needle and printing PETG generated a bit of VOC’s.
The big surprise is when I’m working in that room the amount of CO2 I generate and how long it takes to dissipate. It’s quite easy to tell when I’ve been popping in and out based on spikes in the chart.
Anyways, project turned out cool and I wanted to share. 🙂